31 Jan 2025
The Dashboard section in the Actions module provides users with a comprehensive overview of their compliance tasks, offering valuable insights into progress and performance. This section is designed to help users track and measure their actions against the planner, ensuring nothing falls through the cracks.
Action Area Compliance Summary
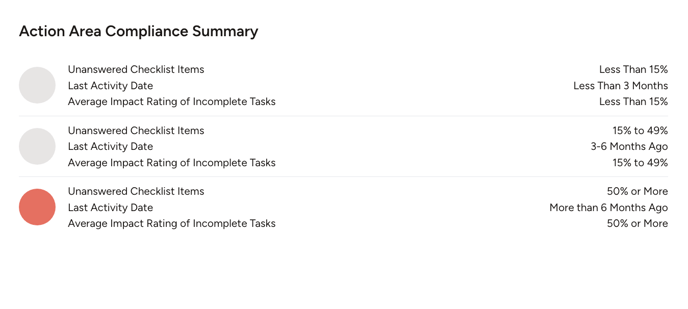
In the Action Area Compliance Summary, users can monitor critical compliance metrics such as:
- Unanswered Checklist Items: Provides an overview of pending checklist items that need attention.
- Last Activity Date: Indicates the most recent activity performed within the Action Area.
- Average Impact Rating of Incomplete Tasks: Highlights the potential impact of incomplete tasks, helping prioritize actions effectively.
This summary allows users to quickly assess areas requiring immediate attention based on activity status and impact level. The summary uses a color-coded system to highlight the compliance status of a site:
- Green: Indicates good compliance when:
- Unanswered Checklist Items: Less than 15%.
- Last Activity Date: Within the last 3 months.
- Average Impact Rating of Incomplete Tasks: Less than 15%.
- Yellow: Indicates moderate compliance concerns when:
- Unanswered Checklist Items: Between 15% and 49%.
- Last Activity Date: Between 3–6 months ago.
- Average Impact Rating of Incomplete Tasks: Between 15% and 49%.
- Red: Signals critical compliance issues when:
- Unanswered Checklist Items: 50% or more.
- Last Activity Date: More than 6 months ago.
- Average Impact Rating of Incomplete Tasks: 50% or more.
This visual representation helps users identify and address priority areas effectively.
Task Status Summary
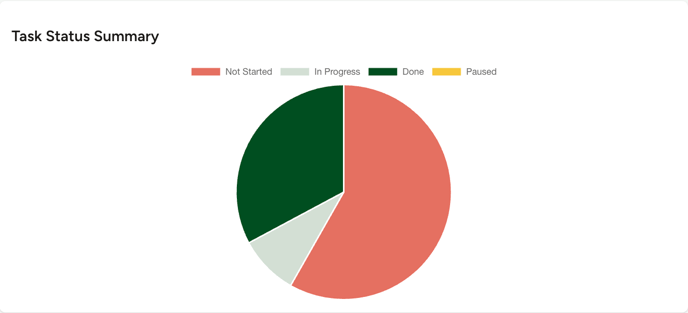
The Task Status Summary provides a clear visual overview of the progress of tasks within the Actions module. Represented in a pie chart, it categorizes tasks into the following statuses:
- Not Started: Tasks that have been assigned but have yet to be initiated.
- In Progress: Tasks currently being worked on.
- Done: Completed tasks that meet all compliance requirements.
- Paused: Tasks temporarily put on hold.
Users can hover over the chart to view the exact number of tasks in each category, offering a quick breakdown of the task statuses. Additionally, clicking on a specific category will redirect the user to the Task Manager, where they can directly manage tasks in that category, ensuring streamlined task prioritization and resolution.
Action Area Compliance Stats

The Action Area Compliance Stats section provides an overview of the compliance status across all defined action areas. The metrics displayed include:
- Action Areas: The total number of action areas currently being tracked.
- Yes: The number of action areas marked as fully compliant.
- Partial: The number of action areas with incomplete compliance or partial progress.
- No (Unanswered): The number of action areas with unanswered compliance tasks or areas marked as non-compliant.
This dashboard enables users to quickly assess overall compliance performance and identify areas requiring immediate attention.
Task Stats

The Task Stats section provides a comprehensive summary of task-related metrics within the Actions module, helping users monitor progress and prioritize efforts. The displayed metrics include:
- Total Tasks: The total number of tasks assigned across all action areas.
- Overdue Tasks: The number of tasks that are past their due dates, requiring urgent attention.
- Task Completion Rate: The percentage of tasks successfully completed, highlighting overall progress.
- Incomplete Rate: The percentage of tasks still pending completion, helping identify areas that may need additional focus.
If users click on any of the fields, they will be redirected to the Task Manager, where they can manage their tasks in detail. This functionality enables users to review, update, and take action on tasks directly from the stats overview, streamlining task management.
Tasks Over Time Chart
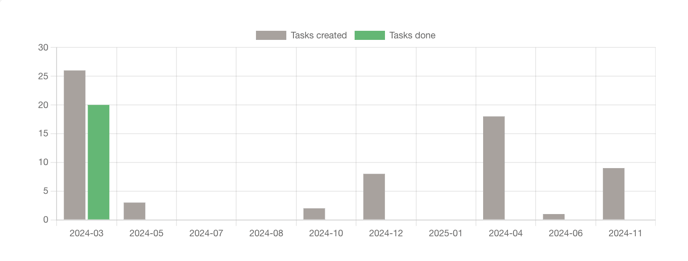
The Tasks Over Time Chart provides a visual representation of tasks created and completed within a specific time frame. The gray bars represent the number of tasks created, while the green bars indicate tasks that have been completed during that period.
This chart allows users to:
- Identify trends in task creation and completion rates over time.
- Assess whether task completion is keeping pace with task creation.
- Pinpoint periods of high activity or backlog.
By hovering over the bars, users can view the exact number of tasks created and completed for a given period. Additionally, clicking on any bar redirects users to the Task Manager, where they can review and manage tasks associated with that specific time frame.
Total Task Impact Score Chart

The Total Task Impact Score Chart provides a visual summary of the cumulative impact scores for tasks categorized by their statuses: “Not Started,” “In Progress,” “Done,” “Paused,” and “Overdue.”
By hovering over any bar, users can view the exact total task impact score for that specific status.
Clicking on a bar redirects users to the Task Manager, allowing them to directly review and manage tasks under the selected status.
The chart enables users to quickly identify high-impact areas, such as “Not Started” or “Overdue” tasks, to focus their efforts effectively.
Checklist Status Summary

The Checklist Status Summary provides a clear overview of the progress and responses across quarters, with an emphasis on the current quarter.
Status Breakdown:
- Yes: Checklist items completed with a “Yes” response.
- Partial: Items partially addressed.
- No: Items marked with a “No” response.
- No Answer: Items not yet addressed.
Quarterly Progress:
Displays the distribution of checklist statuses for the previous quarters and the current quarter helping to track trends and improvements over time.
Progress Bar:
A visual indicator showing the proportion of checklist items completed (green) versus pending or incomplete (red).
This chart is designed to give users a comprehensive view of their checklist performance, enabling better prioritization and planning for compliance related activities.
Compliance Over Time

The Compliance Over Time chart allows users to monitor and analyze their compliance performance across specific periods.
Bar Visualization:
Each bar represents a time period, broken down into compliance statuses:
- Green (Yes): Fully compliant.
- Yellow (Partial): Partially compliant.
- Red (No): Non-compliant.
- Gray (No Answer): Unanswered items.
Users can track how compliance levels evolve over time, helping identify improvements or emerging gaps.
By hovering over a segment, users can view detailed data, such as the number of items in each compliance status for a specific time period.
This feature helps teams stay on top of their compliance journey and effectively prioritize actions to improve adherence to regulations.
Task Only View

Users can select the Tasks Only view, where the Action Area Compliance Summary, the Task Status Summary, the Tasks Stats and other metrics are displayed specifically for their assigned tasks, providing a focused and tailored view of compliance progress related to their responsibilities.
Checklist Only View

Users can select the Checklist Only view, where the Action Area Compliance Summary and other metrics are tailored to reflect checklist-specific data. This focused view enables users to easily monitor and track compliance progress exclusively related to checklist items, enhancing task management and accountability.
Filtering Options

The filtering options are available across all views in the Actions module, allowing users to refine their displayed data to focus on specific criteria such as:
- Action Area: Filter by particular Action Areas.
- Control Type: Narrow results based on the type of control e.g. Assessments, Monitoring.
- Topics: Focus on specific topics e.g. Air Quality, Energy, Waste.
- Category: Select from predefined categories to organize and refine your view.
- Projects: View metrics and details tied to specific projects.
These filters can be applied in any view to customize the displayed information. Click Apply to implement the selected filters or Clear to reset them to the default settings, ensuring the data is tailored to your needs no matter which view you’re working in.
Have any questions?
At ERM Libryo, we really want all our users to get the most from our system. We hope that this article was useful. If you still have some questions, please email us.